
Hello, this video contains the guided practical found here: Create a simple Spreadsheet.
This class was recorded on Wednesday 13th January 2021.
© 2021 Vedesh Kungebeharry. All rights reserved.
Hello, this video contains the guided practical found here: Create a simple Spreadsheet.
This class was recorded on Wednesday 13th January 2021.
© 2021 Vedesh Kungebeharry. All rights reserved.
See the video below which introduces spreadsheet software
Spreadsheet – an electronic document in which data is arranged in the rows and columns of a grid and can be manipulated and used in calculations.
Oxford English Dictionary via google. (https://www.google.com/search?q=define+spreadsheet&oq=define+spreadsheet&aqs=chrome..69i57j0l7.4183j1j7&sourceid=chrome&ie=UTF-8)
A Spreadsheet consists as a grid of many cells.
Cell – A single location in a spreadsheet that can store data. It is the intersection of a row and column
row – A horizontal arrangement of cells , usually denoted by a number
column – a vertical arrangement of cells ,usually denoted by a letter, cell,
value – the data that is stored in a cell.
formula – a representation for a calculation stored within a cell. The formula itself is not displayed, rather, the results of the calculation is displayed in the cell.
range – a group of cells; can be a group of horizontal cells, a group of vertical cells, a block of cells, or even many different blocks of cells.
worksheet – a single spreadsheet in a workbook.
workbook – a file , consisting of many worksheets (individual spreadsheets). A workbook is a file which is comprised of 1 or more worksheets (spreadsheets)
(last updated Monday 11th January 2021)
© 2020 Vedesh Kungebeharry. All rights reserved.
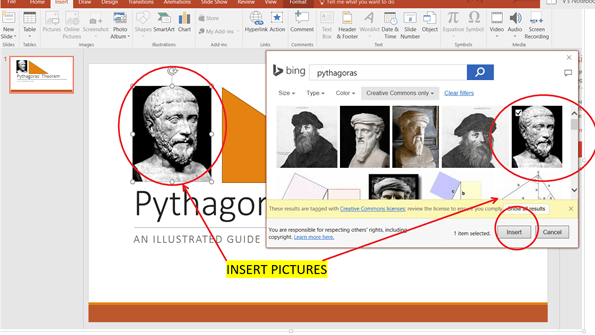
Presentation software is used to display information one slide at a time. The term “slide” can be thought of as a single poster used to display a small number of points or a single idea.
Presentation software was made to mimic the behaviour of a traditional slide projector.
Many slides are displayed one at a time by the presenter. The presenter can include the following items on slides:


Example of presentation software are Microsoft Powerpoint and Prezi.
Required reading :
Students to study Presentations in a full context: http://www.teach-ict.com/gcse_new/software/presentation/miniweb/index.htm
© 2020 Vedesh Kungebeharry. All rights reserved
Consider the following example:
Find the sum of 10 numbers provided by the user.
This can be accomplished as follows:

The above solution is very long as well as difficult to understand , manipulate and communicate .
Observe that there were many repeated steps in obtaining input from the user.
The solution can be simplified by looping.
A general looping construct is shown below:

The solution can be simply implemented using looping:

Class Discussion: walk-through of solution is discussed.
This files used in this post can be downloaded here:
https://drive.google.com/drive/folders/1KjNcPQATyqh8quxnRjUDbJOgdzGvUY1P?usp=sharing
Create an algorithm which uses repetition to output the 12 times table from 1 to 12.
2022-10-6: Added files used in this post.
© 2020 Vedesh Kungebeharry. All rights reserved.
Sometimes we wish to change the order of processing based on certain conditions.
This can be accomplished by using a selection construct pictured below:

We will examine this in the following example:
Jim is a salesman for an auto car company. If his total sales for the week exceeds $10000 he is rewarded a sales commission of 8 percent of the sale, if not he is awarded no commission.
Create a flowchart algorithm which accepts the total sales and outputs the commission.

The problem is modified such that if the total sales were less than $10000 he would receive a commission of 4 percent. See changes below:
Jim is a salesman for an auto car company. If his total sales for the week exceeds $10000 he is rewarded a sales commission of 8 percent of the total sales, if not he is awarded a commission of 4 percent.
Create a flowchart algorithm which accepts the total sales and outputs the commission.
Draw a flowchart for the modified scenario.
© 2020 Vedesh Kungebeharry. All rights reserved.
An algorithm in narrative form is not written in discrete steps. It is expressed as directions in paragraph form and instructions on how rules should be followed.
An algorithm in narrative form can be considered a precursor to pseudocode or a flowchart

An example is given below for the given problem statement
Problem Definition: A solution is needed which finds the circumference of a circle.
Algorithm in narrative form: Prompt the user to enter a non-negative value for the radius and store it. If the radius entered is negative or is not a number, keep on prompting the user and accept values until a suitable value is entered. Use the formula C=2*3.14* r to calculate and store the circumference. Output the circumference to the user and stop processing.
Write an algorithm in narrative form which gives instructions/directions on how to follow the rules in order to play “Snakes and ladders”.
© 2020 Vedesh Kungebeharry. All rights reserved.
Recall that Software is a set of instructions that can be executed by a computer system. System software is used to maintain hardware resources, while application software solves end user problems.
There are, however, other categories of software which are meant to be malicious and disruptive to the computer system.
Research and make brief notes on the following terms:
Viruses, malware, spam, antivirus, firewall, worms, Trojan horses, spyware, ransomware, adware.
2023-09-05 – changed homework components from (Computer viruses, malware, spam, anti- virus, firewall) to (Viruses, malware, spam, antivirus, firewall, worms, Trojan horses, spyware, ransomware, adware.)
© 2020 Vedesh Kungebeharry. All rights reserved.
Copyright is a legal right created by the law of a country that grants the creator of an original work exclusive rights for its use and distribution. This is usually only for a limited time.
Plagiarism the practice of taking someone else’s work or ideas and passing them off as one’s own.
Discussion:
What are some of the consequences of
Answers:
Copyright:
Plagiarism:
Create a list of legal and ethical consequences for
Complete the homework in your ICT Notebook.
Create a hand written copy of your homework for insertion into your IT portfolio.
This assignment will be marked.
http://www.plagiarism.org/plagiarism-101/what-is-plagiarism/
Hacking is gaining unauthorized access to a computer system, network or an ICT device.
Piracy is the unauthorized distribution, reproduction, use or sale of software that are protected by proprietary or free licenses.
1st June 2023 – Added Hacking and piracy to the end of the note.
© 2020 Vedesh Kungebeharry. All rights reserved.
1.Give definitions and a labelled diagram for the following terms:
worksheet, cell, cell address, range, row , column.
2. Create and save spreadsheet document which replicates the following arrangement:
[a student report cart , Subject and marks]
Create and save spreadsheet document which replicates the following arrangement:
| Student Name | Physics | Art | Music | Mathematics | Total |
| Jim | 68 | 98 | 48 | 52 | |
| Mary | 74 | 75 | 76 | 72 | |
| John | 74 | 52 | 52 | 63 | |
| Sally | 42 | 42 | 58 | 69 | |
| MAXIMUM MARK |
Use formulas to calculate the maximum mark and totals for each student.
© 2020 Vedesh Kungebeharry. All rights reserved.
Presentation software is used to display information one slide at a time. The term “slide” can be thought of as a single poster used to display a small number of points or a single idea.
Presentation software was made to mimic the behaviour of a traditional slide projector.
Many slides are displayed one at a time by the presenter. The presenter can include the following items on slides:
Text – including short points on the topic being presented. Text is usually held within a Textbox.
Example of presentation software are Microsoft Powerpoint and Prezi.
Students to study Presentations in a full context: http://www.teach-ict.com/gcse_new/software/presentation/miniweb/index.htm
Feb 2nd , 2022 – Improved readability of post, removed broken links.
© 2020 Vedesh Kungebeharry. All rights reserved
