Task : Create a game where a sprite moves around a few times to a random position and asks the player (user) to guess his x and y coordinates. If both the x and y coordinates entered by the player are within 10 units of the sprites location, say a message which indicates success, otherwise, say that the player missed and tell the player to try again.
A sample of blocks below shows how to move the sprite around:
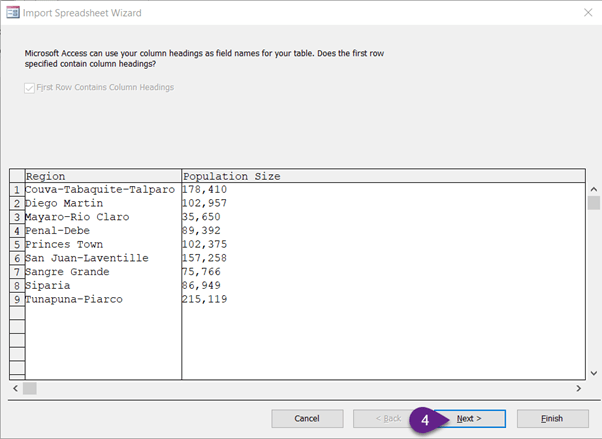
In this tutorial , we wish to import the following data from RegionData.xlsx:
Region
Population Size
Couva–Tabaquite–Talparo
178,410
Diego Martin
102,957
Mayaro–Rio Claro
35,650
Penal–Debe
89,392
Princes Town
102,375
San Juan–Laventille
157,258
Sangre Grande
75,766
Siparia
86,949
Tunapuna–Piarco
215,119
NOTE: If you don’t have the provided excel file, you can always copy and paste the table above into a new excel document, save it, and use it for this tutorial.
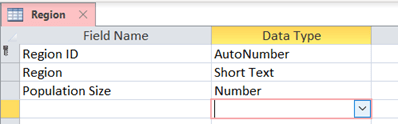
Add a new table named Region. The design View Is shown Below:
Close the table after creation.
2. “RegionData.xlsx” contains data formatted to match the region and population size of our Region table. The column names are the same in both tables. Start the process to Import the data from “RegionData.xlsx”:
a) Select the “External Data” tab
b) Choose “New Data Source”
c) Hover over “From File”
d) Choose Excel
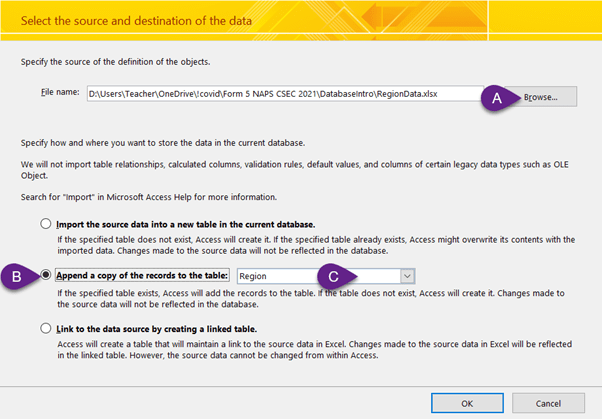
3. Use the wizard:
a) Browse to and select “RegionData.xlsx”
b) Choose “Append a copy…”
c) Select the region table from the dropdown
4. Choose Next:
5. Choose Finish
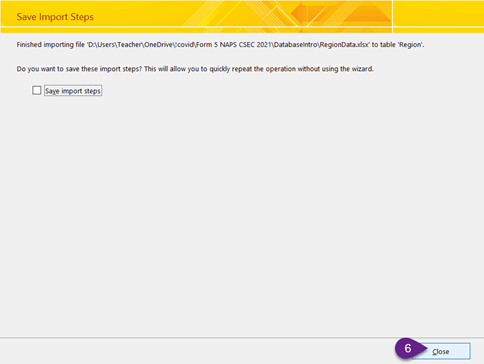
6. Choose Close:
7. Done! Open your table to verify that the data was imported:
In this class , we use the online web application provided by http://typingclub.com . Visit the website and create an account and attempt the first 20 lessons under the typing jungle lesson plan
See the video capture from class today on Wednesday 13th January 2021: