See the Video that demonstrates how to be effective at using EXCEL.
© 2026 Vedesh Kungebeharry. All rights reserved.
See the Video that demonstrates how to be effective at using EXCEL.
© 2026 Vedesh Kungebeharry. All rights reserved.
Download the Template Guide here:
https://drive.google.com/drive/folders/1ZlVz_Kmn7hK667K2eL69VRMy9ab24xlh?usp=sharing
© 2026 Vedesh Kungebeharry. All rights reserved.
© 2026 Vedesh Kungebeharry. All rights reserved.
© 2026 Vedesh Kungebeharry. All rights reserved.
© 2025 Vedesh Kungebeharry. All rights reserved.
© 2025 Vedesh Kungebeharry. All rights reserved.
© 2025 Vedesh Kungebeharry. All rights reserved.
Unfortunately, The audio did not record in this video, I am posting this for the purpose of review for the following class exercise:
Files used in part 1 can be downloaded here: https://drive.google.com/drive/folders/1UPV7cZM5_Oc1oLboxeSrn9K8qV7KBulk?usp=sharing
© 2025 Vedesh Kungebeharry. All rights reserved.
Usually when we create an Excel document, we have an idea of the basic structure for data that is the types of tables we like to use on the charts we’d like to see.
It is interesting to note that a pivot table is not of much use when analyzing data that we have already atomized into various tables across our worksheet(s).
For example we’ve all seen sba’s that provide a summary for a budget for some event, or personal expenses. Because we have an understanding and an intent when we create the budget, we would have all the ready broken our data into tables that show income and expenditures which probably include actual values and estimated values. This data is already mostly summarized and it may be useless to apply a pivot table that gives us any additional insight to what we already know.
Pivot tables are most useful when we have:
In practice pivot tables are usually used on operational data that is highly detailed for atomized and recorded frequently.
When we have a set of unfamiliar data we can use a pivot table to generate many intermediate summary tables that’s a low for us to start making sense of Trends in the data so that we may:
Download the following file I follow along with the list of instructions that follow:
Select the range of data minus the headings from your original table:

Click on insert, recommended pivot tables:

Choose the second option:

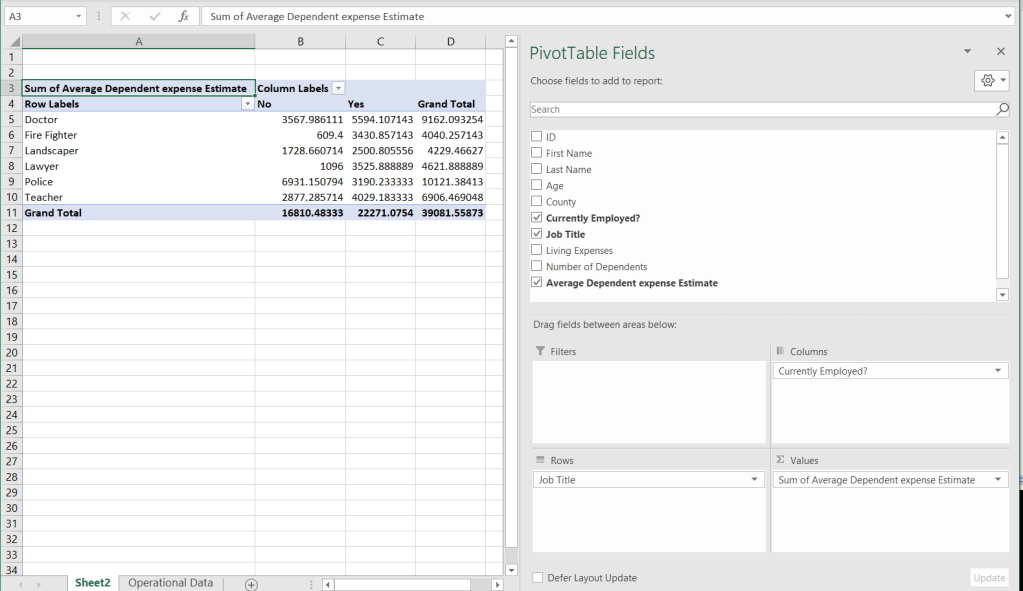
We arrive at pivot table which summarizes our expenses:

Letters format the numerical data, using the regular number formatting options: