
See the Video that demonstrates how to be effective at using EXCEL.
© 2026 Vedesh Kungebeharry. All rights reserved.
See the Video that demonstrates how to be effective at using EXCEL.
© 2026 Vedesh Kungebeharry. All rights reserved.
Usually when we create an Excel document, we have an idea of the basic structure for data that is the types of tables we like to use on the charts we’d like to see.
It is interesting to note that a pivot table is not of much use when analyzing data that we have already atomized into various tables across our worksheet(s).
For example we’ve all seen sba’s that provide a summary for a budget for some event, or personal expenses. Because we have an understanding and an intent when we create the budget, we would have all the ready broken our data into tables that show income and expenditures which probably include actual values and estimated values. This data is already mostly summarized and it may be useless to apply a pivot table that gives us any additional insight to what we already know.
Pivot tables are most useful when we have:
In practice pivot tables are usually used on operational data that is highly detailed for atomized and recorded frequently.
When we have a set of unfamiliar data we can use a pivot table to generate many intermediate summary tables that’s a low for us to start making sense of Trends in the data so that we may:
Download the following file I follow along with the list of instructions that follow:
Select the range of data minus the headings from your original table:

Click on insert, recommended pivot tables:

Choose the second option:

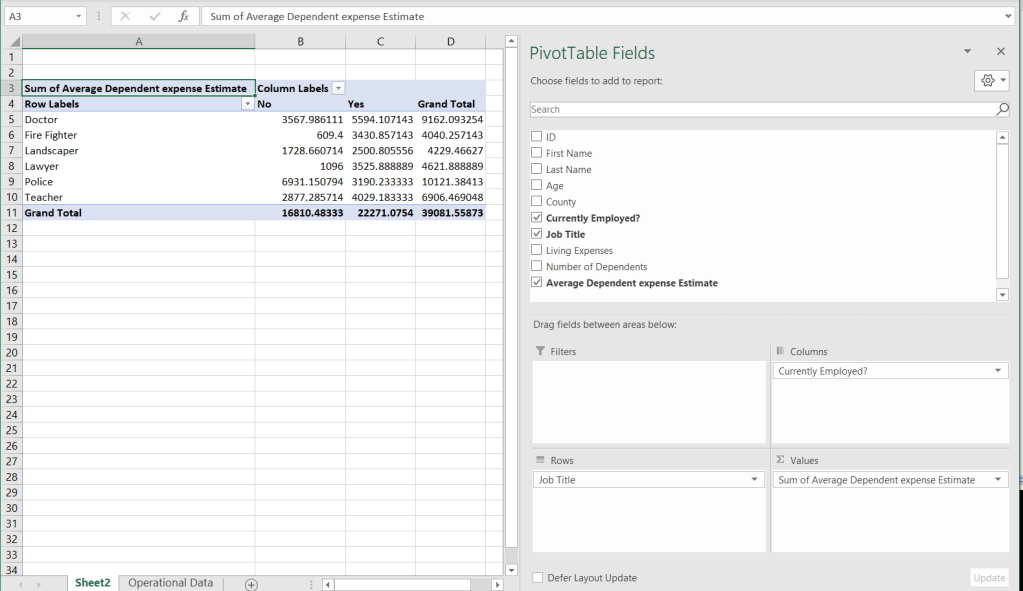
We arrive at pivot table which summarizes our expenses:

Letters format the numerical data, using the regular number formatting options:
See the video below:
https://www.youtube.com/watch?v=2iudU1eWcr8
Required reading: Information technology For CSEC examinations ,
3rd Edition Pgs. 265-267
Class demo in Flowgorithm:
Declare num1, Num2, assign, find sum.
Find the area of a circle based on the radius input by a user.
Teacher uses terminology in demonstration:
Declare, Identify, assign , initialize, Datatype
-Teacher shows how an algorithm can be generated to store numbers input by the user.
-Teacher demonstrates how the variables can change
-Teacher demonstrates how integer variables
truncate real variables.(i.e int x = 5.7 results in x storing the value 5.)
Teacher shows how pi cannot be changed in
Flowgorithm.
© 2025 Vedesh Kungebeharry. All rights reserved.
See the following objective content and related videos
These videos were chosen for each topic because they cover the subject matter in a relevant context. They definitely were not created specifically for the CSEC an Syllabus, however , they do address the fundamental concepts in real world scenarios.
(Created for CSEC syllabus, but some content also applies to NCSE ICT)
© 2025 Vedesh Kungebeharry. All rights reserved.
See the file that was produced in the video below:
https://drive.google.com/drive/folders/1kdWDBMqJXqLfFPF0kV_D_Rv3WlYhVDqu
Video:
https://youtu.be/csmY-zdNOuA
© 2023 Vedesh Kungebeharry. All rights reserved.
© 2023 Vedesh Kungebeharry. All rights reserved.
Marks were assigned on 11th Jan 2023 for groups 1 and 2 and 22nd Jan 2023 for groups 3,4,5.
© 2023 Vedesh Kungebeharry. All rights reserved.
https://youtu.be/Kr8tyBU4SEg
© 2023 Vedesh Kungebeharry. All rights reserved.
See video below:
https://youtu.be/fiv75dM_VXE
© 2023 Vedesh Kungebeharry. All rights reserved.
There are several ways in which algorithms can be represented:
Narrative form is a way of representing an algorithm using a story or a sequence of events. This representation is often used to describe algorithms in a way that is easy for humans to understand, but it can be difficult to translate into a programming language.
For example, an algorithm for sorting a list of numbers could be represented in narrative form as follows:
Here is an example of an algorithm in narrative form that explains the steps for using a menu system to withdraw money from an ATM:
Narrative form is often used to describe algorithms in a way that is easy for humans to understand, but it is not as precise as other forms of representation, such as pseudocode or programming language.
Pseudocode is a way of representing an algorithm using a combination of natural language and programming language constructs. It is often used to represent algorithms in a way that is easy for humans to understand, but that can also be easily translated into a programming language.
Here is an example of pseudocode for calculating the simple interest on a loan:
START CalculateSimpleInterest(principal, rate, time)
INPUT: float principal, float rate, float time
OUTPUT: float interest
interest <- principal * rate * time
RETURN interest
END
This pseudocode represents an algorithm that calculates the simple interest on a loan given the principal amount, interest rate, and time period. It starts by calculating the interest as the product of the principal, rate, and time. It then returns the value of interest as the output of the algorithm.
In this pseudocode, principal, rate, and time are the input variables, and interest is the output variable. The keyword START indicates the start of the algorithm, and the keyword END indicates the end of the algorithm. The keyword INPUT specifies the input variables, and the keyword OUTPUT specifies the output variable. The keyword RETURN is used to return the output of the algorithm.
Flowchart symbols are graphical symbols used to represent different parts of an by showing the flow from one step to another. Here are some common flowchart symbols and their meanings:
Flowchart symbols are used to represent the different steps and decisions in an algorithm in a way that is easy for humans to understand and visualize. They are an important tool for representing algorithms and are widely used in a variety of fields.
Here is a table showing the advantages and disadvantages of algorithms represented in different forms:
| Form | Advantages | Disadvantages |
| Narrative | – Easy for humans to understand | – Not precise |
| – Can be used to describe complex algorithms in an intuitive way | – Difficult to translate into a programming language | |
| – Can be used to communicate algorithms to people who are not familiar with programming languages | ||
| Pseudocode | – Easy for humans to understand | – Still, it is not a real programming language, so it may require some translation to be implemented in a computer program |
| – Can be easily translated into a programming language | ||
| – Allows for a high level of precision and detail | ||
| Flowchart | – Easy for humans to understand and visualize | – May require more time and effort to create than pseudocode or narrative forms |
| – Can be used to communicate algorithms to people who are not familiar with programming languages | – May not be as precise as pseudocode | |
| – Can be helpful for understanding and debugging algorithms |
As you can see, each form of representation has its own advantages and disadvantages. The form that is most suitable for a given situation will depend on the needs and goals of the person representing the algorithm.
[1] TA-Note
